
In this post I will demonstrate three ways of creating and populating an HTML table with JavaScript, examining the advantages and disadvantages of each.
Continue reading
In this post I will demonstrate three ways of creating and populating an HTML table with JavaScript, examining the advantages and disadvantages of each.
Continue reading

This is version 1.1 of my ongoing JavaScript SVG Library, the first being here. In this version I have added the ability to insert styles or CSS classes which can be reused across multiple elements instead of having to specify colors etc. individually.
Continue reading

I recently published Version 1.0 of my Interactive Periodic Table in JavaScript and in this brief post I will describe the enhancements for Version 1.1.
Continue reading

The periodic table is a chart found pinned to the wall of every school chemistry lab showing various pieces of information on each element, or type of atom. The information is tightly packed and often difficult to read and understand so I decided to develop an interactive web-based version in JavaScript which is easier to use and comprehend than a static paper version.
My original intention was to simply produce a filterable version of the table, and in this post I have done just that. However, while researching the topic I found that it was far more complex than I originally realised and that there is huge scope for expanding the topic to show more infomation and also to show the existing information in different formats. This is therefore an ongoing project which I will enhance in the future. Watch this space...
Continue reading

The math.js library I have used in a couple of previous posts includes comprehensive functionality for handling matrices, and in this post I will demonstrate how to use it for creating matrices as well as basic matrix arithmetic.
Continue reading

I have already written a couple of small SVG libraries, one in C and one in Python. However, the most useful and widespread use of the SVG format is within web pages so in this post I will begin to develop a JavaScript SVG library.
This first version has quite modest ambitions: just the ability to draw a few simple shapes as well as text. However, SVG is far more capable than most people realise so I will add further functionality in the future with the aim of creating a far more comprehensive library.
Continue reading

The math.js library which I used in my post on SI Prefixes in JavaScript also includes comprehensive functionality for handling complex numbers. In this post I will demonstrate how to use this, as well as providing an insight into the underlying arithmetic involved.
Continue reading
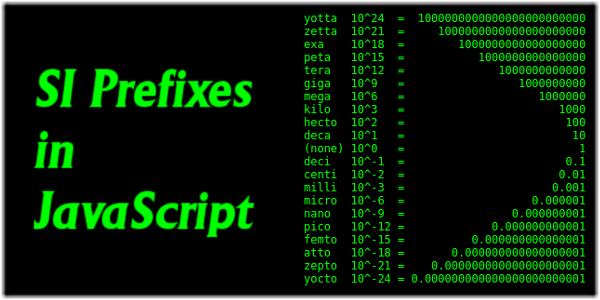
Most people are familiar with a few of the more common prefixes used before many units to denote a fraction or a multiple of the unit - kilograms, megabytes, centimetres etc.. As well as these there a number of less well known ones, going right up to yotta and right down to yocto.
A while ago I wrote a post on SI Prefixes in Python to list all the prefixes along with their corresponding powers and multipliers. When I started writing an equivalent in JavaScript I soon hit a brick wall when I realised that JavaScript's Number type couldn't provide the precision needed.
Searching around for a solution to the problem I discovered the excellent math.js library which, amongst many other things, provides us with a BigNumber type and I thoroughly recommend reading the documentation here. This post covers my simple little JavaScript project to list the numeric SI prefixes.
Continue reading

Benford's Law describes the distribution of the first digits of many, if not most, sets of numeric data and in this post I will implement a demonstration of the law in JavaScript.
Benford's Law centres on the perhaps surprising fact that in numeric data such as financial transaction, populations, sizes of geographical features etc. the frequencies of first digits follow a roughly reciprocal pattern.
Continue reading

Most cameras and image editing applications will generate histograms of image data, showing the distributions of colours for the three channels, red, green and blue. As part of an Electron application I am working on I developed a JavaScript implementation of image histograms using the NodeJS Jimp package. This is it...
Continue reading